Demand and supply

Demand
Definition: Demand is a consumer's ability and willingness to purchase a good or service at a given price in a given time period.
The law of demand
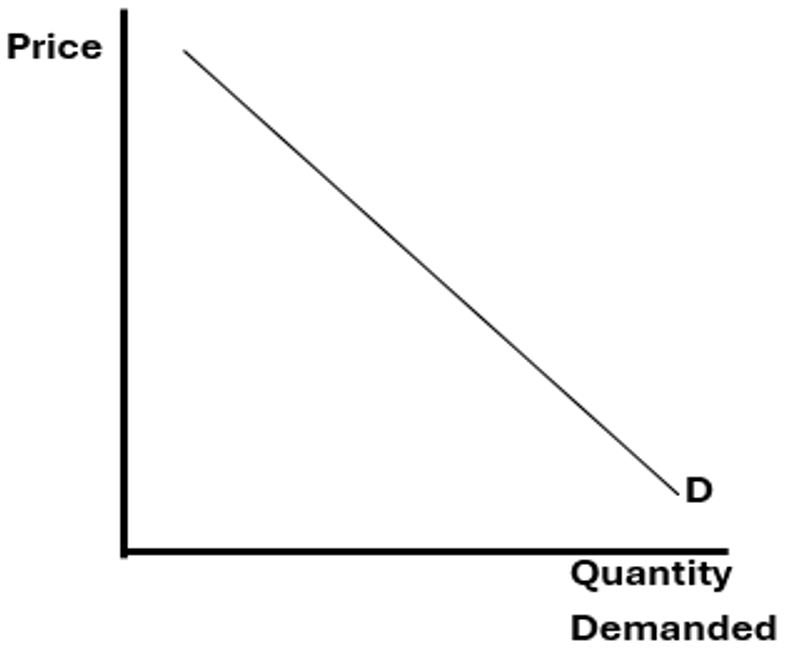
The law of demand states that the quantity purchased of a good varies inversely with price meaning that the higher the price of a good or service, the less quantity that is demanded by consumers. This is due to the consumers aiming for a maximisation of utility, which is easier to achieve when goods are cheaper, hence demand rises when goods are made cheaper.
The demand curve that is true for all normal goods and services in which the law of demand can be seen below:
Exceptional goods
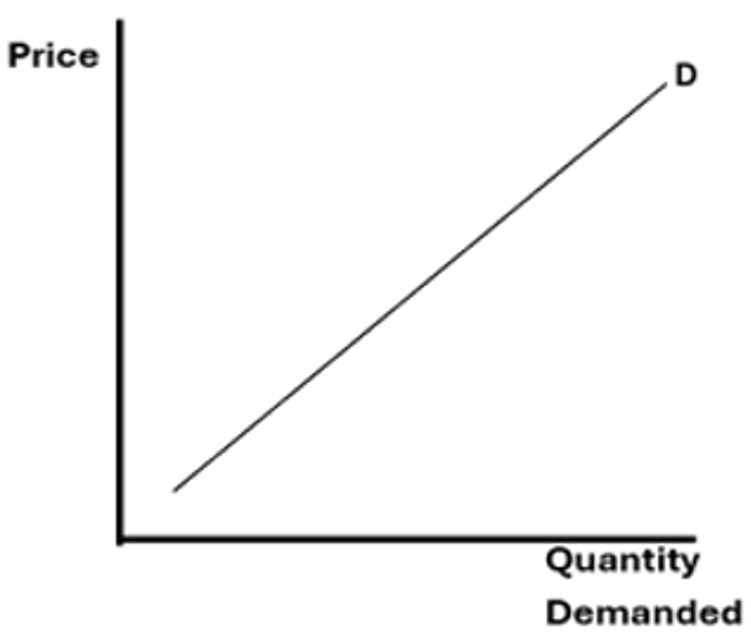
However, this is not true for all products and some can break this trend which are called exceptional goods. Two examples of exceptional goods are speculative goods and ostentatious goods. Speculative goods are goods which are purchased with the hope of them becoming more valuable in future, such as stocks, and ostentatious goods are products which holds the attraction of an expensive image and a high social status, such as designer clothing. The exceptional demand curve can be seen below:
Movements along the demand curve
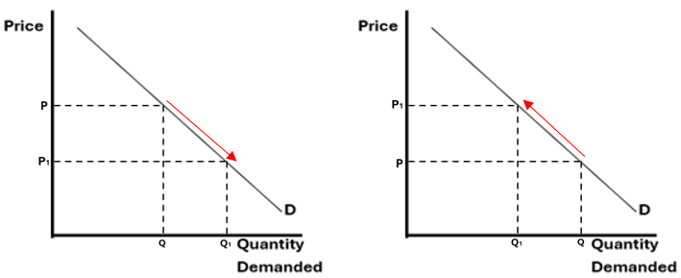
Movements along the demand curve can occur due to a change in price. Two movements can occur which are extensions and contractions. An extension in demand is when the quantity demanded of a good or service increases due to a decrease in price and a contraction in demand is when the quantity demanded of a good or service decreases due to an increase in price and these can both be seen below:
Shifts in the demand curve
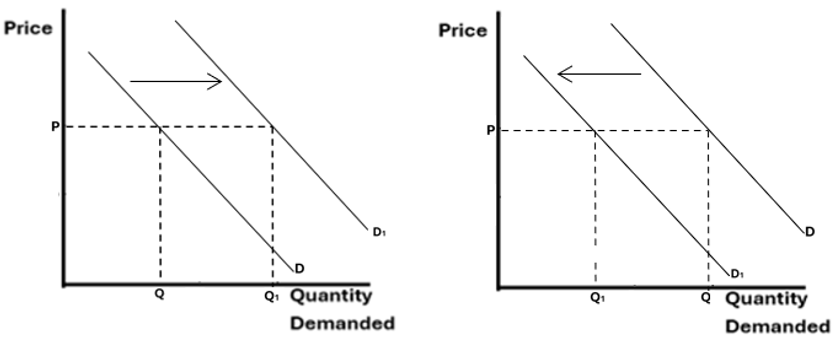
A shift in demand represents a change in the quantity demanded of a good or service at every respective price level due to various economic factors. Demand can shift both to the left (inwards) and the right (outwards) if the quantity demanded at each price level decreases or increases respectively and this is shown below:
There are 10 conditions which cause demand to shift
- Change in real income.
- Changes in tastes and fashion.
- Effective marketing.
- Change in structure or size of the population
- Government policies
- Price expectations
- Change in price of substitute goods
- Change in price of compliment goods
- Change in weather
- State of the economy
Price Elasticity of Demand (PED)
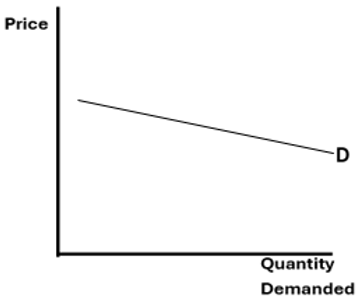
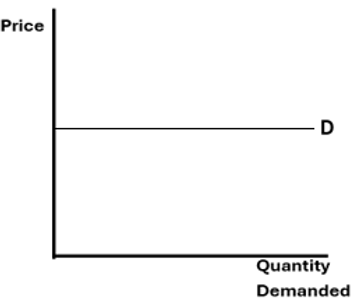
PED is the price elasticity of demand and is the responsiveness of quantity demanded of a good or service to a change in the price of the good or service. PED is calculated by dividing the percentage change of the change in the quantity demanded over the percentage change of the change in the price.

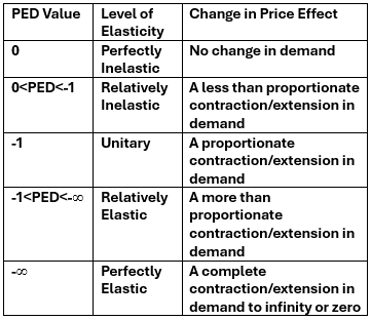
PED graphs for each level of elasticity
Perfectly Inelastic
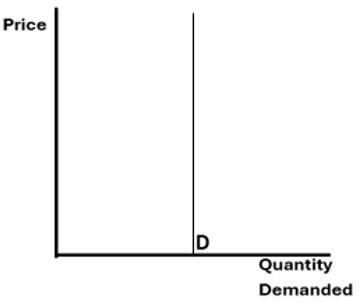
Relatively Inelastic
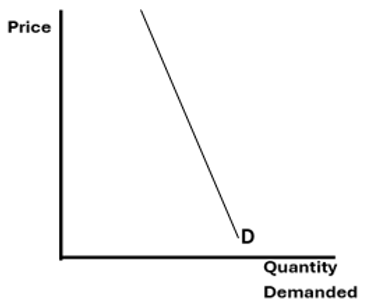
Unitary
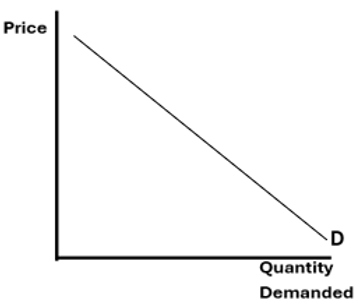
Relatively Elastic
Perfectly Elastic
Factors affecting PED
- Whether the good is a necessity (inelastic) or luxury (elastic)
- The proportion of income spent being low (inelastic) or high (elastic)
- The competitiveness of the market being low (inelastic) or high (elastic)
- The length of the time period being short (inelastic) or long (elastic)
- The product being addictive (inelastic) or non-addictive (elastic)
- The width of definition being broad (inelastic) or narrow (elastic)
The effect of an increase in price on total revenue at each PED value
Perfectly Inelastic
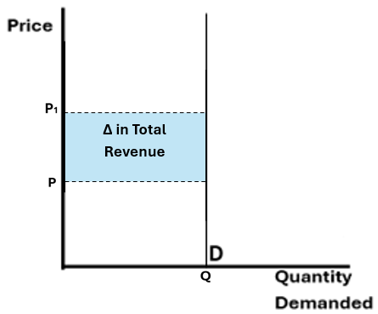
Relatively Inelastic
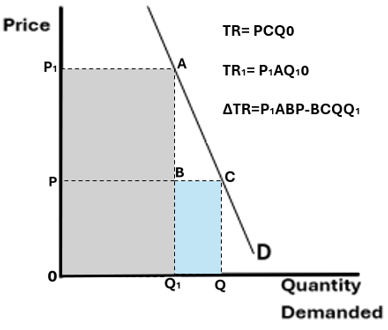
Unitary
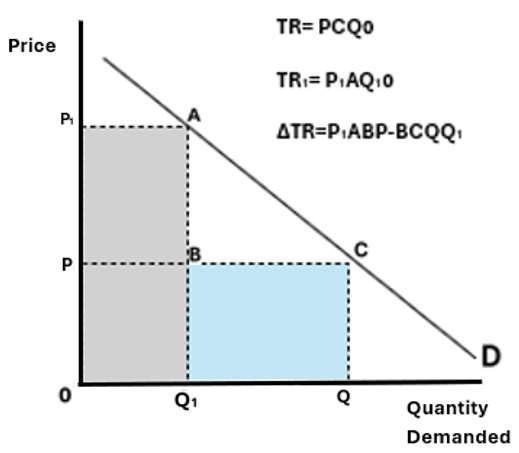
Relatively Elastic
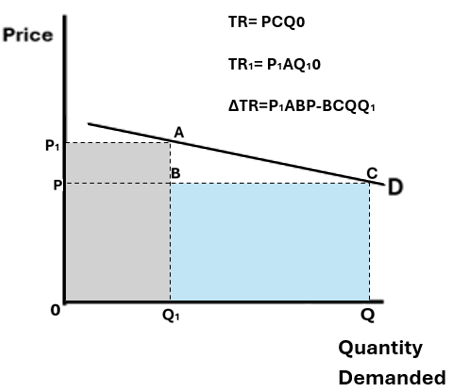
Perfectly Elastic
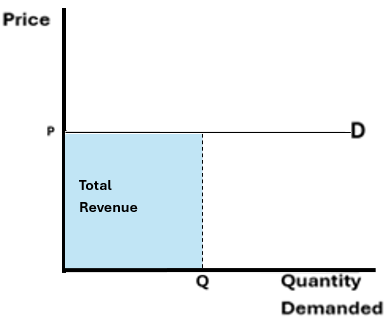
XED
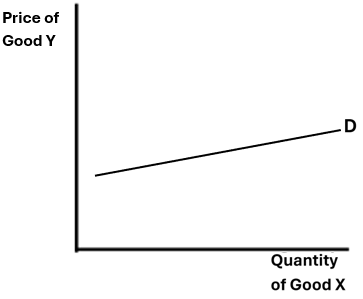
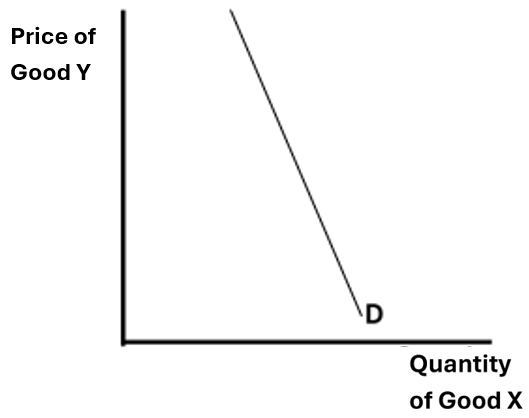
XED (cross elasticity of demand) is the responsiveness in demand of Good X to a change in price of Good Y. The formula for its calculation is below:

- If the XED calculation results in a positive value, the two goods are substitutes for each other.
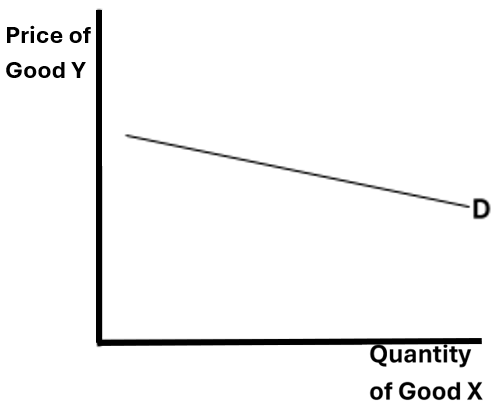
- If the XED calculation results in a negative value, the two goods are compliments to each other.
Substitutes
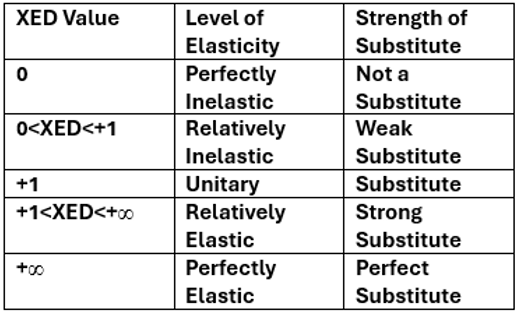
XED graphs for substitutes
Weak Substitutes
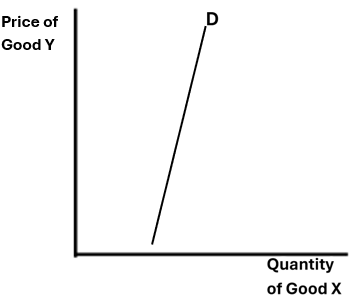
Strong Substitutes
Complements
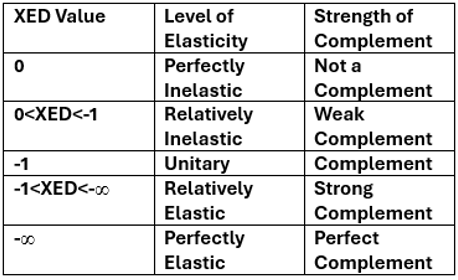
XED graphs for complements
Weak Complements
Strong Complements
YED
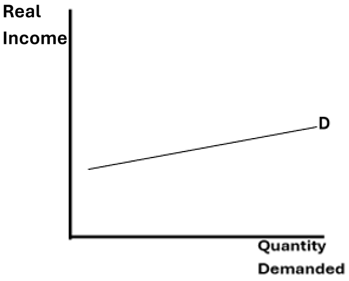
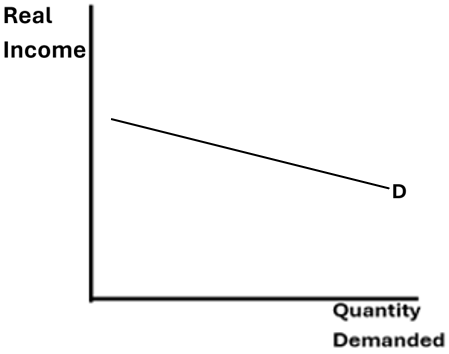
YED (income elasticity of demand) is the responsiveness of demand to a change in real income (income adjusted for the rate of inflation). The formula for its calculation is below:

If YED is positive, then the good is a “normal” good or service and if YED is negative the good or service is “inferior”. For a wealthy person, a normal good could be a luxury sports car (the good that they would purchase in a booming economy) and an inferior good could be a second hand vehicle (the good that they would purchase in a recession).
YED graphs for normal goods and services
Relatively Inelastic
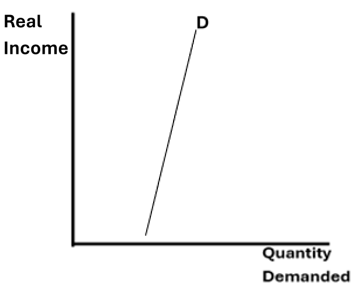
Relatively Elastic
YED graphs for inferior goods and services
Relatively Inelastic
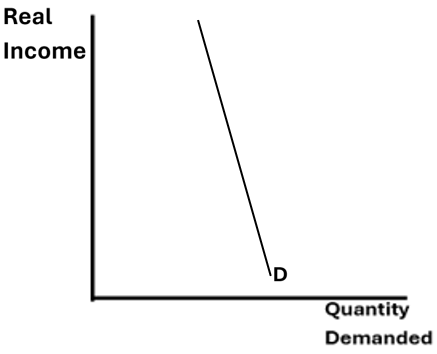
Relatively Elastic
Diminishing marginal utility and rational decision making
The law of marginal diminishing utility is where decreased satisfaction comes from more consumption. Less satisfaction from extension in quantity demanded causing the consumer to pay less, thus a decrease in price. This is the idea that as you purchase more units, you are less willing to pay the same price.
The basic thought of rational decision making for producers is that they will aim to be profit maximisers. Profit maximisation is the process of seeking the highest possible profit or satisfaction from economic decisions. This is a key objective of the majority of private sector firms.
Supply
Definition: Supply is the willingness and ability of a producer to supply a good or service at a given price at a given time period.
The law of supply
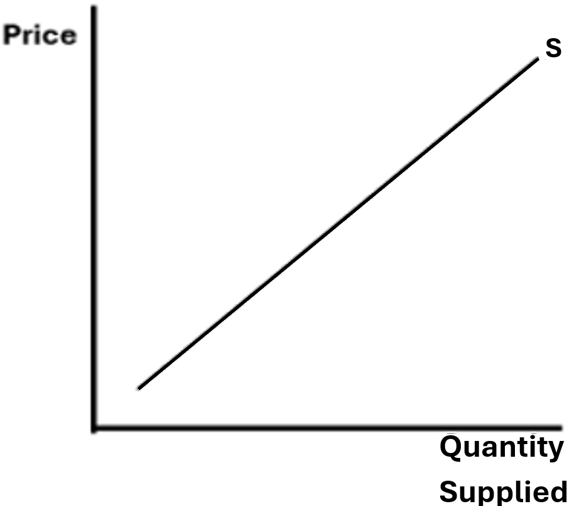
The law of supply suggests that as the price of a good or service increases, the quantity supplied will also increase. This is due to the theory of producer profit maximisation, where producers extend their supply when prices increase, resulting in a direct relationship between the two variables.
The supply curve for all normal goods can be seen below:
Movements along the supply curve
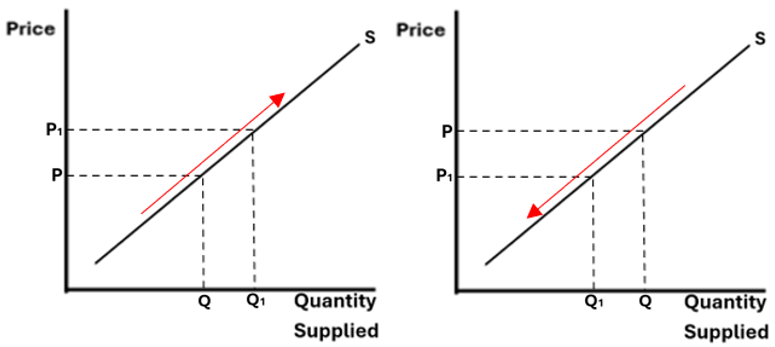
Movements along the supply curve can occur due to a change in price. An extension in supply is when the quantity supplied of a good or service increases due to a decrease in price. A contraction in supply is when the quantity supplied of a good or service decreases due to an increase in price and these can both be seen below:
Shifts in the supply curve
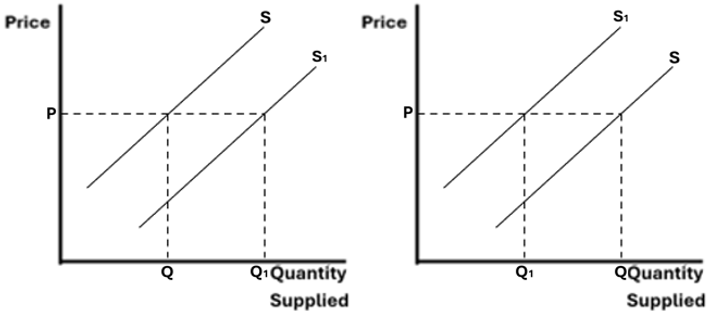
A shift in supply represents a change in the quantity supplied of a good or service at every respective price level due to various economic factors and supply can shift both to the left and the right if the quantity supplied at each price level decreases or increases respectively and this is shown below:
There are 7 conditions which cause supply to shift
- Price of the good
- Price of related goods
- Production conditions
- Future expectations
- Input costs
- Number of suppliers
- Government policies
Price Elasticity of Supply (PES)
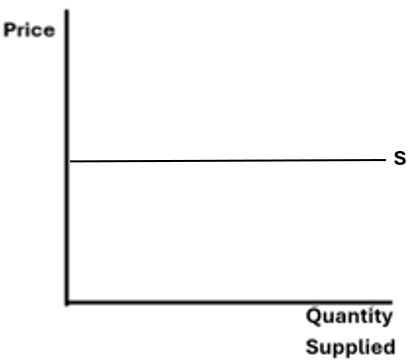
PES is the price elasticity of supply and is the responsiveness of quantity supplied of a good or service to a change in the price of the good or service. PES is calculated by dividing the percentage change of the change in the quantity supplied over the percentage change of the change in the price.

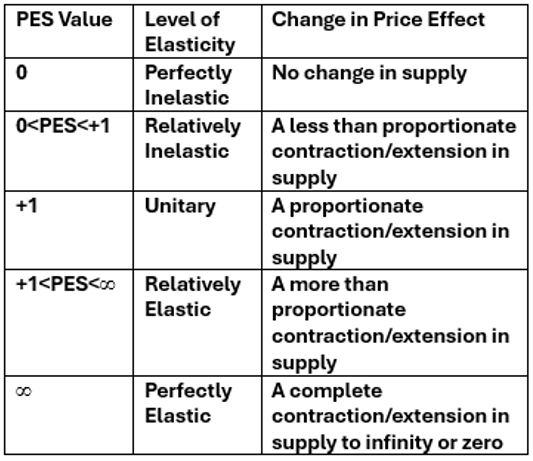
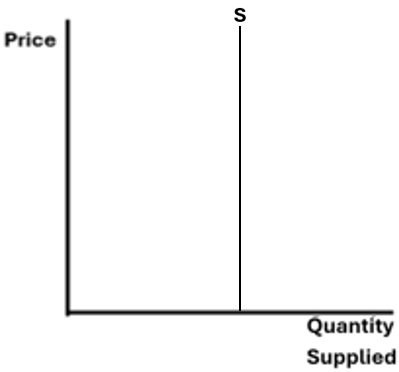
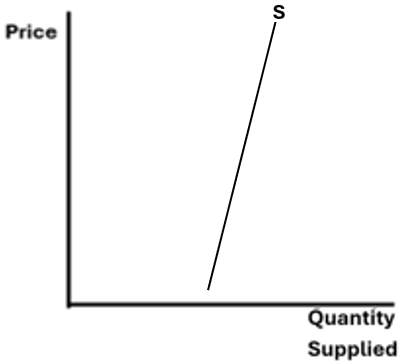
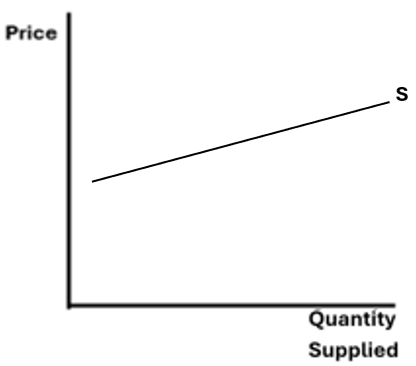
PES graphs for each level of elasticity
Perfectly Inelastic
Relatively Inelastic
Unitary

Relatively Elastic
Perfectly Elastic
Factors affecting PES
- Number of producers
- Level of spare capacity
- Ease of switching
- Ease of storing
- Length of production period