Aggregate demand and supply

Aggregate Demand
Aggregate Demand (AD) allows governments to be able to measure and achieve economic growth. However, too much AD creates demand-pull inflation, whereas too little AD creates cyclical unemployment. This means that AD has to be stimulated at an optimal rate somewhere in between too much and too little, to achieve economic growth without halting other macroeconomic objectives.
The components of AD
AD consists of 4 main components: Consumption (C), Investment (I), Government Spending (G) and Net Trade (X-M). It is usually written as:
AD=C+I+G+(X-M)
- Consumption: A calculation of the total household expenditure on goods and services in an economy. Consumption makes up around 60% of AD.
- Investment: A calculation of the total amount of expenditure by businesses or individuals on capital such as machinery. This may also include stocks. Investment makes up around 14% of AD.
- Government spending: A calculation of the total expenditure used by the government to affect the economy as a whole. Government Spending makes up around 25% of AD.
- Net trade: A calculation of the difference between the value of imports and the value of exports in an economy. Net Trade makes up around 1% of AD.
The AD curve
The AD curve displays the relationship between the price level and the real output of an economy. Generally, real output is seen to inversely relation to the price level due to a number of factors.
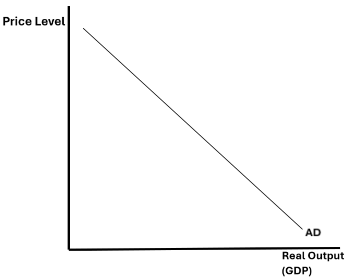
The AD curve slopes down due to 3 economic effects:
- Real income effect: When the price level falls in an economy, the real value of income rises. Therefore, the level of demand in the economy rises, thus increasing real output.
- Interest rate effect: When the price level falls in an economy, it is likely that the Central Bank will raise the interest rates. This increases the incentive to borrow, thus leading to increased real output.
- Balance of trade effect: When the price level falls in an economy, the demand for exports may rise as the country becomes more price competitive. This may lead to more export revenue which can incentivise producers to extend output, thus increasing GDP.
Movements along the AD curve
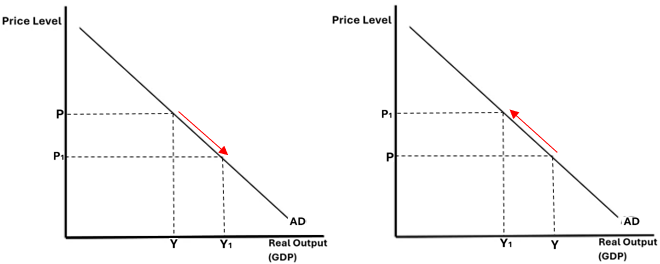
Movements along the AD curve are caused by changes in the price level (inflation or deflation). Two movements can occur which are extensions and contractions. An extension in AD is when the real output increases due to a decrease in the price level and a contraction in AD is when the real output decreases due to an increase in the price level and these can both be seen below:
Factors that affect components of AD (causes of shifts in AD)
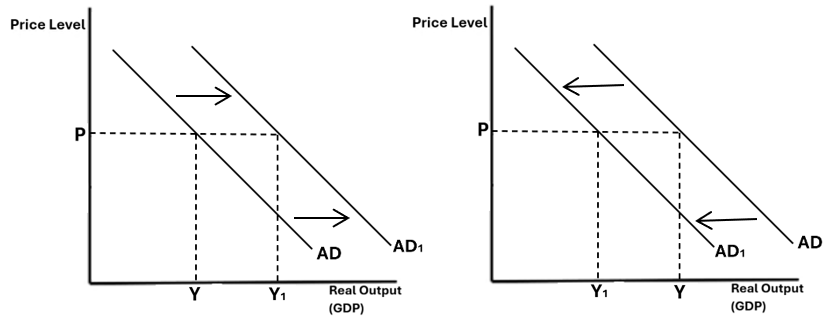
Shifts in AD are cause when one of the components in AD are stimulated or reduced. For example, if the consumption of the economy increases, the AD curve will shift outwards. The extent of the AD curve shift depends on:
- The magnitude of the change: The higher the increase in one of the components, the further the AD curve will shift.
- What component is changed: The fact that each component makes up a different proportion of AD means that if a component with a larger proportion in AD is changed, the larger the shift in the AD curve.
A shift in the AD curve (outwards and inwards) is shown below:
Factors affecting Consumption (C):
- Disposable income and Marginal Propensity to Consume (MPC): Disposable income, the income left to spend after any deductions have been made, may cause an increase in consumption if the magnitude of disposable income is increased. However, this may depend on the MPC of a consumer (the percentage of disposable income spent on consumption). Typically, higher income individuals have a higher MPC than lower income individuals due to larger volumes of disposable incomes, which is a driving factor of "trickle-down economics". An increase in disposable income and be brought about by using the expansionary fiscal policy of reducing taxes such as income tax or National Insurance Contributions (NICs).
- Employment and job security: If a worker feels that they are in a safe job, in terms of not being made redundant or fired, they may feel more inclined to consume, as they may feel as though it is likely that they will earn the income spent on consumption, back in the future.
- The wealth effect: The wealth effect is a psychological effect that when the total wealth of a consumer increases, they may feel more financially able than before, as they have more leverage behind them. Therefore, if the general price of assets increase, such as bonds or stocks, it is likely that the consumption of an economy will also increase.
- Expectations and signals: When consumers hear announcements on the news, whether it is politically related, or not they may be inclined to increase their consumption as they are able to afford it more. For example, an announcement that reduces the rate of income tax is likely to increase consumption in an economy, because workers are more likely to earn this money that is spent again.
- Interest rates and Marginal Propensity to Save (MPS): A reduction in interest rates reduces the incentive of saving, reducing an individuals' MPS. This means that they are more likely to spend their disposable incomes on goods and services, thus increasing consumption. Moreover, a reduction in interest rates reduces the cost of borrowing, which in turn can increase the number of loans taken out, increasing consumption further.
Investment (I):
Gross investment: Gross investment is a calculation of the amount that the economy spends specifically on new capital such as new equipment or machinery. This calculation also takes an estimation for capital depreciation, as some investment is needed each year to replace antiquated equipment or technology.
Net investment: Net Investment is a calculation of gross investment subtracting capital depreciation. If the gross investment figure outweighs capital depreciation, then net investment totals to a positive value.
Factors affecting Investment (I):
- Rate of economic growth: It is likely that a growing economy will give confidence to investors, when GDP growth rates and employment rates are positive. This may make investors feel more optimistic about returns on their investments, encouraging demand for assets such as stocks, bonds and properties.
- Animal spirits: High animal spirits may give businesses a "feel good factor", where they may increase investment if they are confident about the future of the business. For example, if an entrepreneur is confident about the next 10 years of the business, it is likely that they will buy long-lasting, expensive capital thus increasing investment.
- Access to credit/ interest rates: When access to credit is high, it allows for increased borrowing in an economy which encourages increased investment. Additionally, this may be paired with low interest rates, where the cost of borrowing is reduced and more loans are taken out, further increasing investment.
- Demand for exports: If the demand for exports decrease, then export revenue may decrease leading to less investment in capital that relate to overseas markets. This means that the firms may only choose to invest in specialised capital for their domestic market, reducing investment.
Factors affecting Government Spending (G):
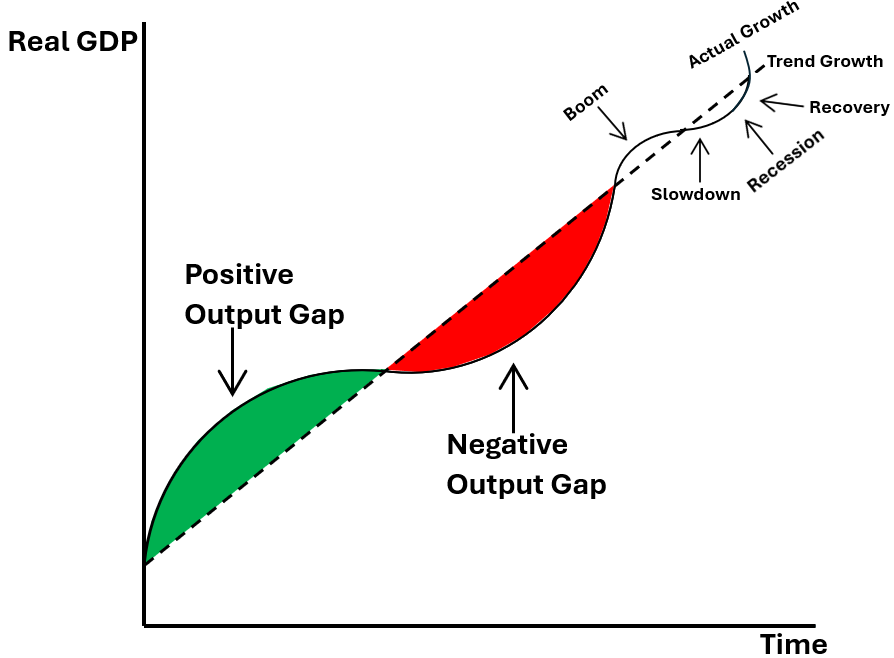
- The trade cycle: The government may use additional expenditure, as the role of an interventionist to prevent a huge recession and stimulate AD, moving the economy towards recovery. They may be able to stimulate AD by spending more, since G takes up 25% of AD. Below shows a diagram illustrating the mechanism of the trade cycle:
- Fiscal policy: If there is "fiscal headroom", which refers to the amount of money a government can spend before it breaks its fiscal rules, then the government may use expenditure to positively affect the economy as a whole, thus increasing government spending.
Factors affecting Net Trade (X-M):
- Real income and Marginal Propensity to Import (MPM): An increase in real income may increase living standards for individuals in that country. This in turn can make them demand higher quality goods and services, of which can be found abroad, increasing their MPM. This in turn can worsen net trade, reducing aggregate demand.
- Appreciation of the currency: An appreciation of the currency means that exports become more expensive, reducing demand for exports. Conversely, imports become cheaper, resulting in a worsening of net trade and thus a decrease in AD.
- Depreciation of the currency: A depreciation of the currency means that exports become cheaper, increasing demand for exports. Conversely, imports become more expensive, resulting in an improvement of net trade and thus an increase in AD. However, this depends on the Marshall Lerner condition (the condition that the PED for imports and exports is above 1, unitary).
Aggregate Supply
Aggregate Supply (AS) refers to the overall supply of goods and services produced in an economy. This represents the total quantity of output that firms are able and willing to produce, in a given time period, at a given price. AS can be important in an economy, as it can determine the success of many macroeconomic objectives, namely economic growth, reducing unemployment and price stability.
Short-Run Aggregate Supply (SRAS)
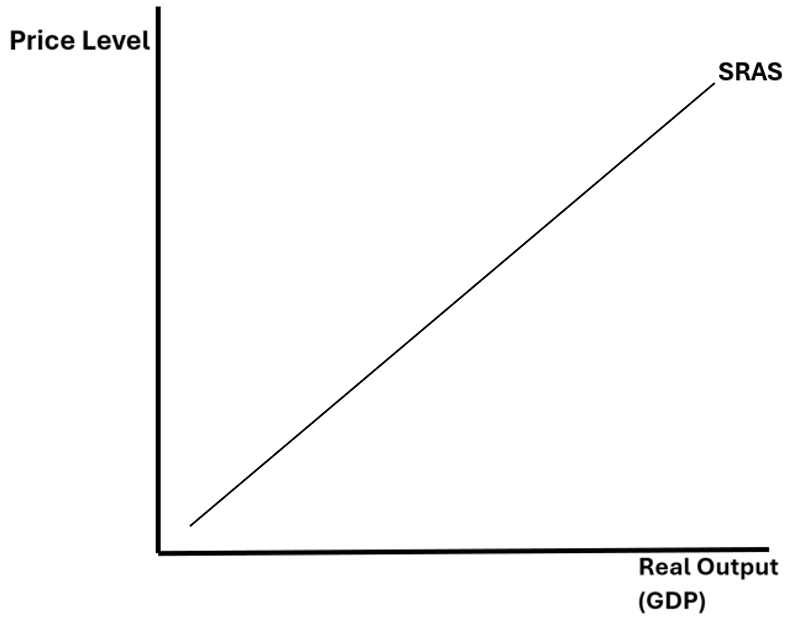
SRAS represents the total quantity of goods and services that firms in an economy are willing and able to produce at the price level in the short run, with the short run being a period during which some factors of production may not be able to adjust to changes in economic conditions. The SRAS curve is typically seen as sloping upwards, indicating that as the overall price level in the economy rises, firms are willing to produce more output, in order to maximise profits. This upward slope is often attributed to sticky wages and prices, where in the short-run, wages and prices may not adjust immediately to changes in demand or supply conditions.
Movements along the SRAS curve
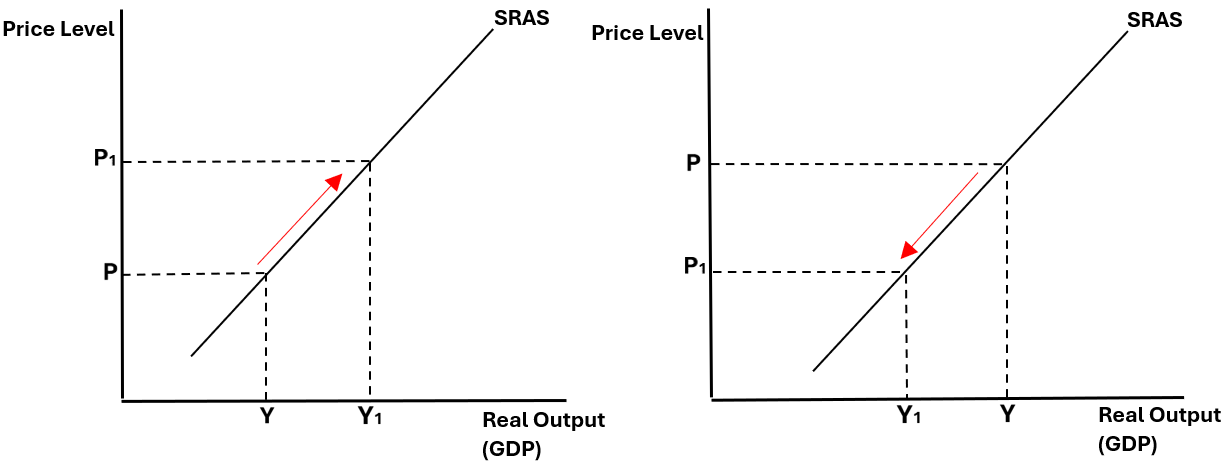
Movements along the SRAS curve are caused by changes in price. When the price of a product increases, it will lead to an extension in supply. This is because the profit-maximising producers aim to create as much profit as possible, and seize the opportunity to do so by extending supply when prices are higher. Conversely, when prices drop, supply is likely to be contracted as they are now no longer maximising profit.
Shifts in the SRAS curve
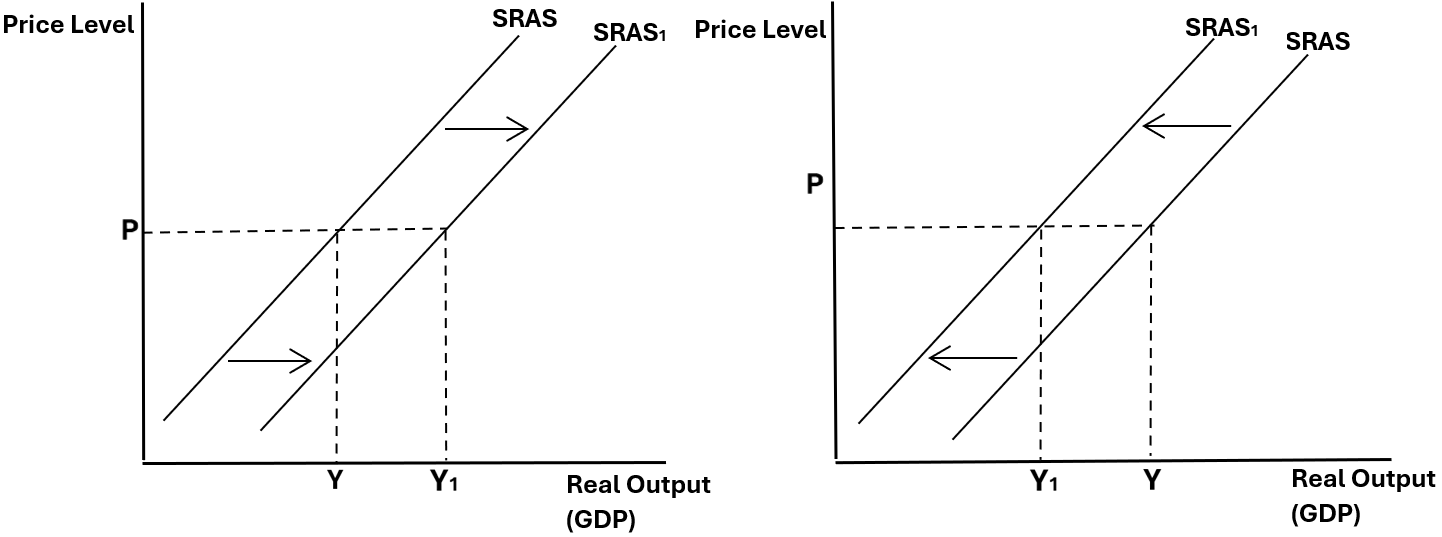
A diagram illustrating the shift is shown below:
Factors causing shifts in SRAS:
- Changes in the Cost of Production (CoP): Commonly, fluctuations in the prices of raw materials and energy will change SRAS. This is because firms will be producing the same quantity of goods under different costs. For example, if raw material costs were to rise, SRAS would shift inwards, as producers would only be able to produce less for the same amount of money they spent on costs, before they rose.
- Changes in the taxes and subsidies: Higher tax rates would result in an inward shift in SRAS, because firms will have less funding to produce their goods. Whereas increased subsidies would result in an outwards shift in SRAS, because firms have increased means to produce their goods, and thus can produce more than before they had a subsidy.
- Exchange rates: A change in exchange rates will change the cost of production for import reliant producers. A weakening of the currency will result in more expensive imports and thus higher production costs, shifting SRAS inwards. Conversely, a strengthening of a currency will result in cheaper imports with lower production costs, leading to an outwards shift in SRAS.
Long-Run Aggregate Supply (LRAS)
Classical
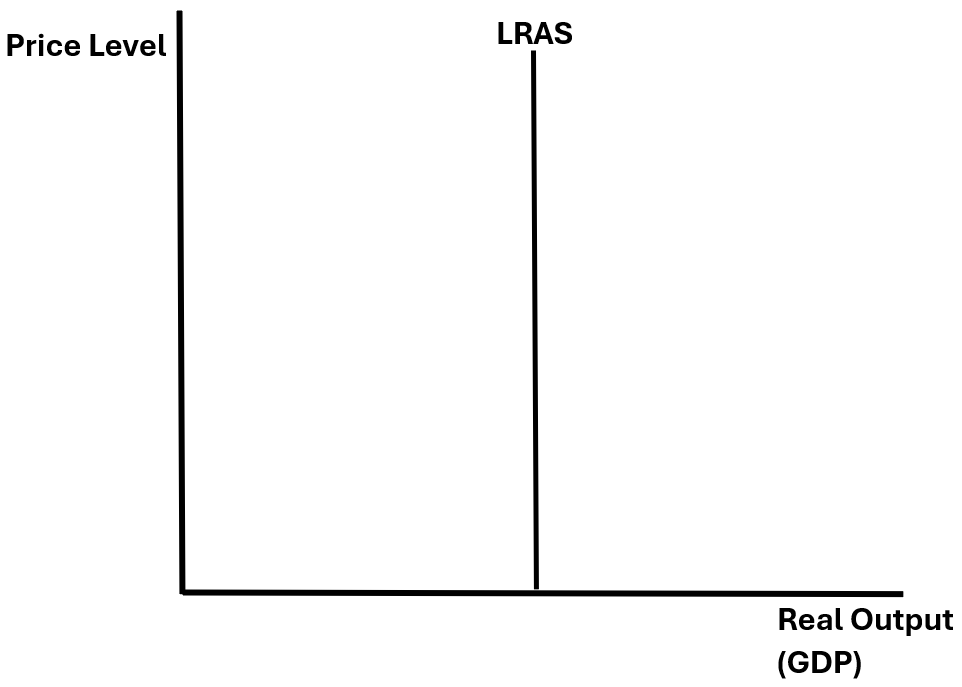
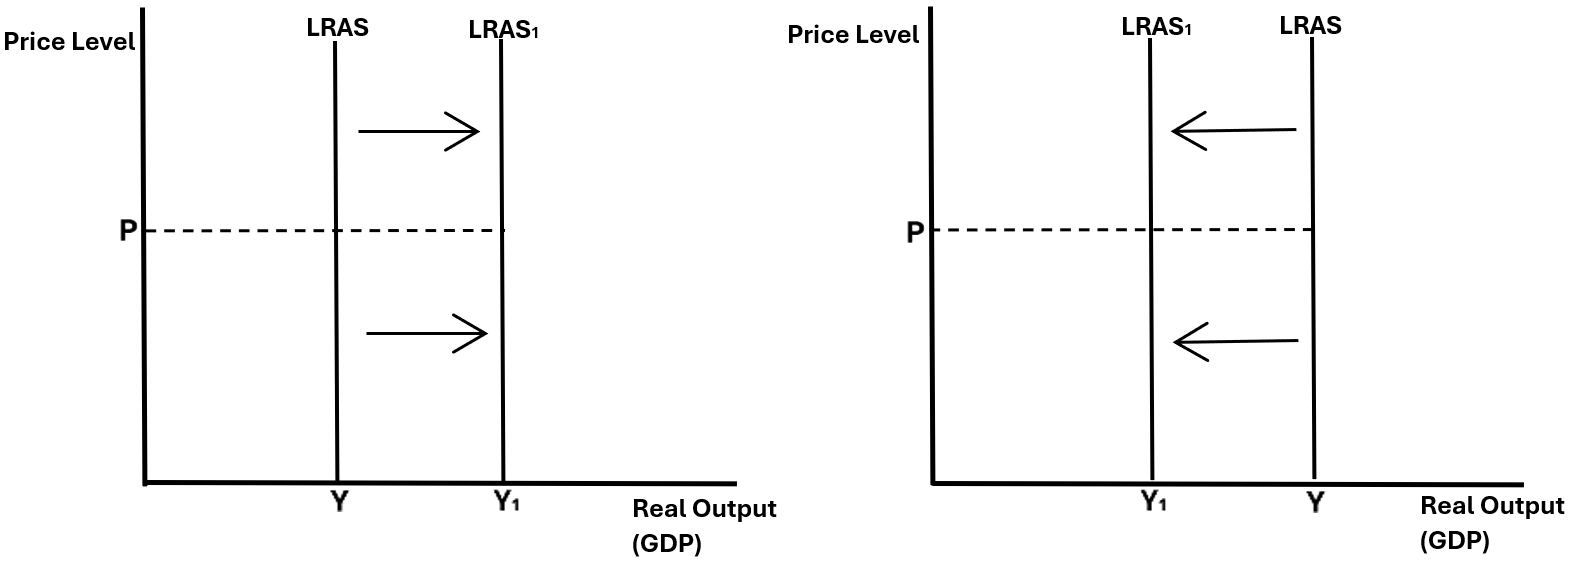
Long-Run Aggregate Supply (LRAS) is decided by the quality of the factors of production in the economy, with the price level being irrelevant to its determination. LRAS can be linked to the idea of Productive Potential Frontier (PPF) which shows the maximum number of two goods that can be produced, when all factors of production are used to their maximum potential. This productive capacity of the economy can be exceeded in the short-run, when factors of production are able to contribute overtime, however, this is not feasible in the long-term, because eventually workers will need a holiday or will be tired, and capital will become antiquated, broken or need maintenance. The classical LRAS curve shape is based on the free market view, that equilibrium will always be reached from the market forces of supply and demand, meaning that in the long-run, all factors of production are fully employed. This means the shape of the classical LRAS curve is perfectly inelastic and completely vertical.
Keynesian
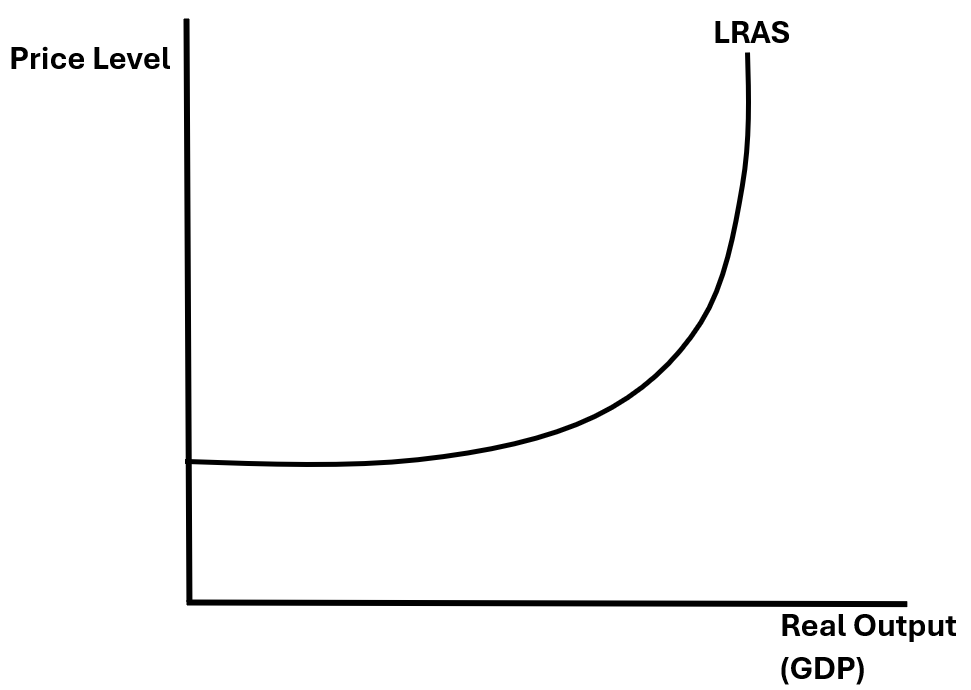
The economist, John Maynard-Keynes, proposed a new LRAS curve in disagreement to the classical school of economics, due to his theory that the economy can be in disequilibrium for long periods of time. At the end of this LRAS curve, just like the classical theory, it is perfectly inelastic, or vertical. However, unlike the classical curve, it does not stay completely vertical. This is because the classical school believe that when unemployment occurs, wages will fall thus making it more desirable for producers to hire workers, pushing up the employment rate once again. But Keynes believed that wages tend to be "sticky downwards" and do not adjust smoothly with unemployment. This is due to multiple reasons:
- Unions stop wages from falling
- Workers are less willing to work for lower wages
- The minimum wage may stop wages from falling
- Businesses are not willing to risk providing lower wages because it may lead to decreased efficiency
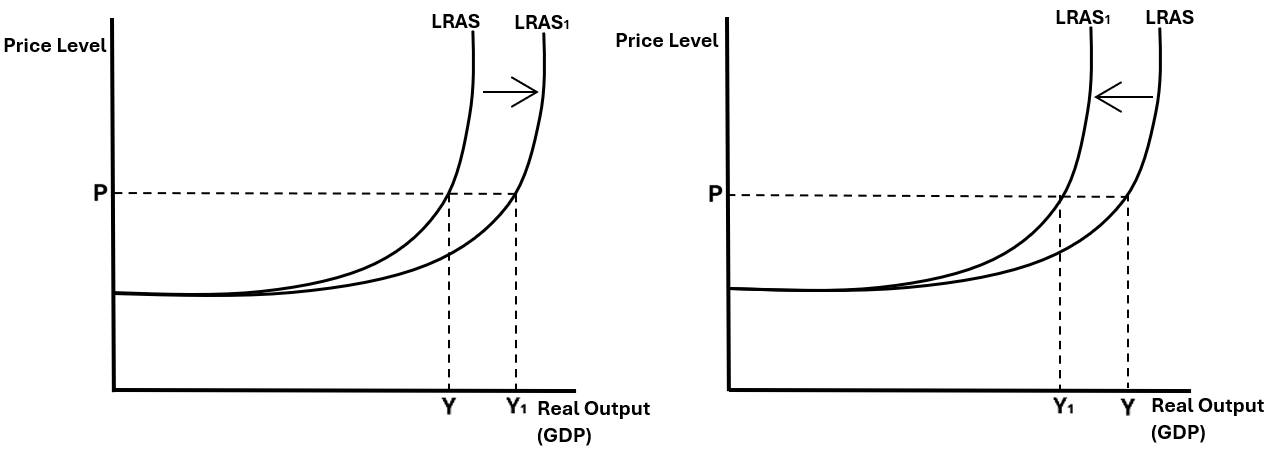
This means that there are periods in time when the economy where the economy is not at full capacity, hence there is an output gap, and the curve slopes off. When there is high levels of unemployment in the economy, shown by the horizontal part of the curve, firms do not have to give higher wages to their workers because LRAS is perfectly elastic. However, as employment rises, firms have to offer higher wages to attract workers, because labour is becoming scarce, which consequently leads to a higher price level, shown by the curve. This trend of labour scarcity is followed, which results in a more inelastic LRAS curve as you go along.
Shifts in the LRAS curve
A diagram illustrating the shift in both types of LRAS shown below:
Classical:
Keynesian:
Factors causing shifts in LRAS:
- Technological advances: As technology progresses and becomes faster, producers are able to produce more goods and services, using less resources in a less amount of time. This means that the productive potential of the economy will increase thus leading to an outwards shift in LRAS.
- Increased productivity: If workers are able to produce more output, per unit time, LRAS shifts outwards. Moreover, if the UK becomes more productive, it may encourage more Foreign Direct Investment (FDI) which can further shift LRAS outwards.
- Increased quality in education: An increase in the quality of education is able to increase worker productivity, which thus shifts LRAS outwards. Additionally, the government may choose to provide training to unemployed workers, which is another form of education allowing them to develop new skills within the workforce. This increases the productive capacity of the economy, thus further shifting LRAS outwards.
- Regulation changes: The government can enforce changes to regulations which may increase the size of the workforce. For example, they can reduce the National Insurance Contributions (NICs) rate, which will incentivise economically inactive workers to join the workforce once again or for the first time. With more workers in the economy, it is likely that LRAS will shift outwards.
- Competition policy: The government can use competition policy which incentivises firms to increase the quality of their goods or set lower prices. This may shift LRAS outwards because it may increase productivity within these firms thus increasing the productive capacity of the economy.
- Migration: Increased migration into a country may increase the size of a countries workforce which therefore increases the productive potential of an economy and shifts LRAS outwards. However, the success of this hinges on the number of migrants who are known as "economic migrants", and move into a country to find work.